

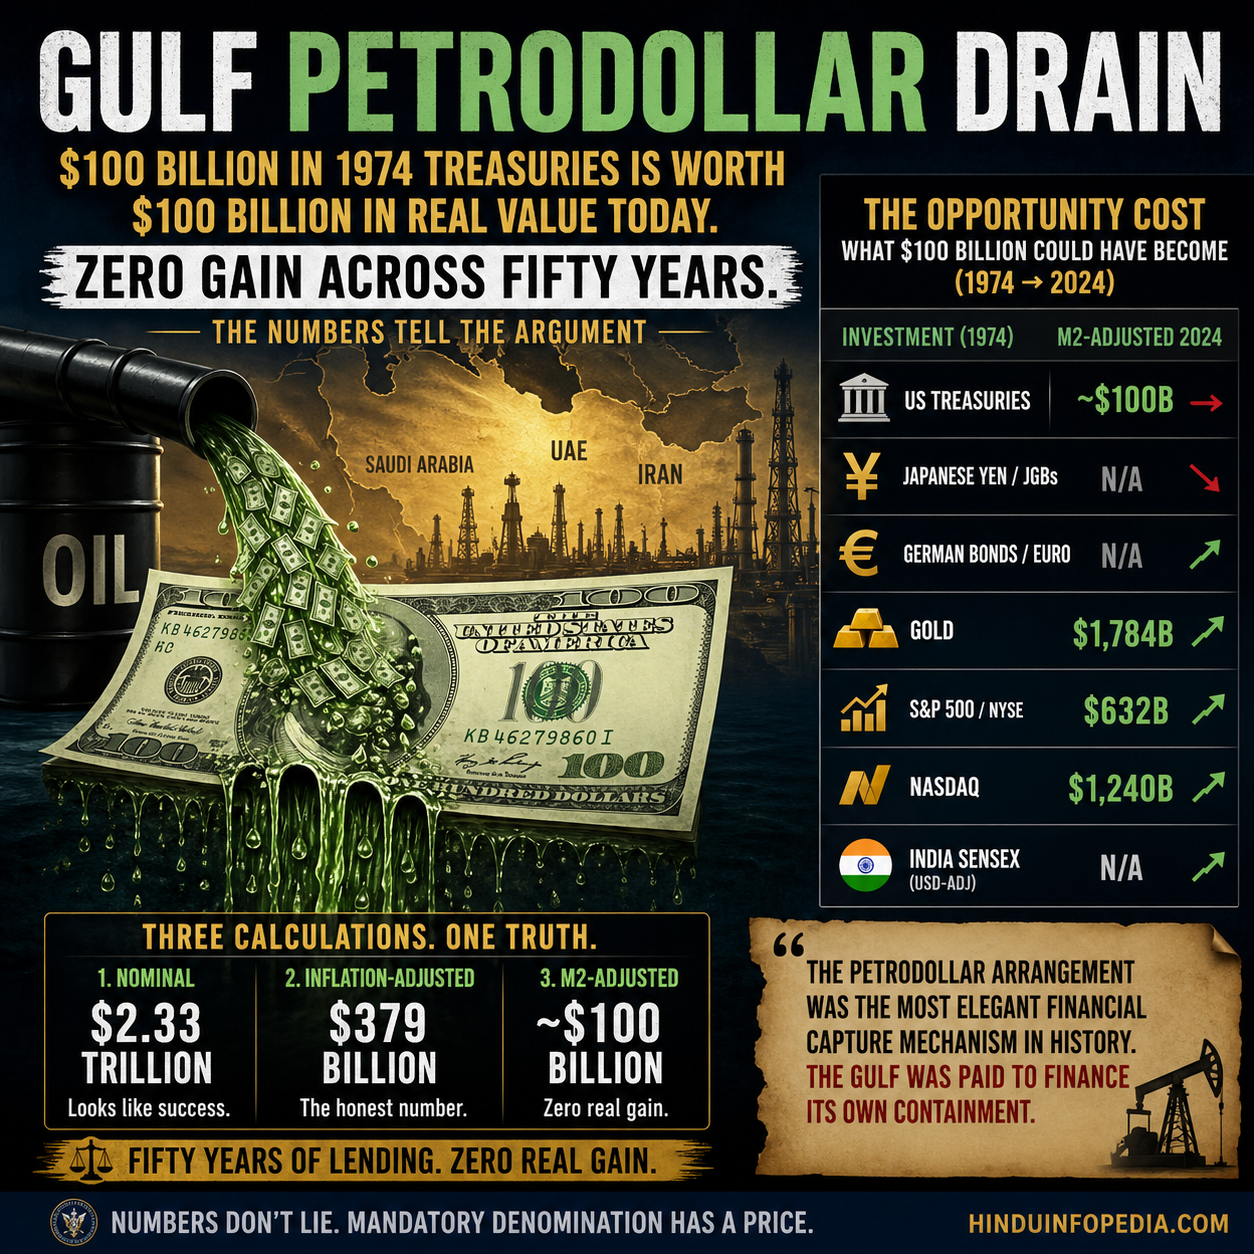
Gulf Petrodollar Drain: A Reckoning of West Asia’s Endless War (49)
Part 49 of the West Asia’s Endless War Series
भारत / GB
$100 Billion Invested in 1974 US Treasuries Is Worth $100 Billion in Real Value Today. Zero Gain Across Fifty Years. The Numbers Tell the Argument.
Blog 48 established the UAE OPEC Split — 59 years of membership ended May 1 2026 without consulting Saudi Arabia, communicating to Iran through commercial action what no phone call could say. Blog 49 asks the question the split makes urgent: what did fifty years of mandatory dollar denomination actually cost? Gulf Petrodollar Drain presents the arithmetic — three calculations on $100 billion, a full comparison table across seven investment alternatives, and the Indian market as the comparison case that carries its own lesson about currency erosion and nominal return. The drain works by being invisible. This blog makes it visible.
Gulf Petrodollar Drain: The Three Calculations
Gulf Petrodollar Drain: $100 billion in 1974 Treasuries is worth $100 billion in real value today. Zero gain across fifty years. The drain works by being invisible. A Gulf sovereign wealth fund invests $100 billion in US Treasury bonds in 1974 — the year the JECOR framework was signed and the petrodollar arrangement formalised. Blog 37 established that this arrangement was signed under duress — not as a free market choice but under the constraint of the 1953 Iran precedent. Fortune documented the petrodollar system as “America’s greatest secret weapon” — allowing Washington to borrow cheaply, run persistent deficits, and still maintain the world’s reserve currency. What happened to that $100 billion is three separate calculations, each revealing a different layer of the Gulf Petrodollar Drain.
Calculation One — Nominal value: the flattering number.
US 10-year Treasury yields averaged approximately 6.5% per annum across 1974-2024 — high in the Volcker era of the early 1980s, low during quantitative easing 2010-2021, recovering in 2022-2024. $100 billion compounded at 6.5% for fifty years grows to approximately $2.33 trillion nominally. The account statement reads $2.33 trillion. The Gulf sovereign wealth manager presents a 23-fold return to the ruling family. It looks like success.
Calculation Two — Inflation-adjusted: the honest number.
US inflation averaged 3.8% per annum across 1974-2024. The Bureau of Labor Statistics confirms that $100 billion in 1974 purchasing power requires $650 billion in 2024 dollars simply to break even. The $2.33 trillion nominal figure, deflated by cumulative US inflation, yields approximately $379 billion in real 1974 purchasing power. A 2.7% real annual return across fifty years — less than the global economic growth rate, less than gold, less than land, less than almost any productive asset class.
Calculation Three — M2 money supply adjusted: the true number.
Inflation figures measure price changes in consumer baskets. They do not fully capture the dilution of monetary share that dollar printing produces. The correct measure is M2 money supply expansion — the actual growth of the total dollar pool in which Gulf holdings sit. Federal Reserve data confirms US M2 grew from approximately $900 billion in 1974 to $21 trillion in 2024 — a 23.3-fold expansion.
Imagine the global dollar pool as a giant reservoir of 50 trillion. A Gulf sovereign wealth fund holds 1 billion inside it. Washington prints another 10 trillion for its deficits, stimulus, or wars. The reservoir instantly becomes 60 trillion. That 1 billion share automatically shrinks to five-sixths of its previous weight. This dilution is not theory. It is mechanical. The United States can do this repeatedly because the dollar is the world’s reserve currency. Oil, global trade, and foreign reserves are priced in dollars. Extra printed dollars flow outward and are absorbed by the rest of the planet without immediate collapse. The effect remains slow and largely invisible to the holders.
Contrast this with Bangladesh or any non-reserve currency nation. If Dhaka prints an extra 20% of takas, the dilution hits immediately and brutally: the taka collapses, inflation spikes into double digits, reserves drain, and food prices explode. No one outside Bangladesh wants the extra takas, so the new money cannot be exported. The pain is fast and visible.The petrodollar arrangement forced the Gulf into the one currency whose issuer enjoys this unique protection. Gulf oil earnings had to be held in the exact instrument Washington could dilute with the least consequence.
The $100 billion investment compounded nominally 23.3-fold. The money supply also expanded 23.3-fold. The compounding and the printing cancelled each other precisely. After fifty years of lending Washington money: the Gulf is back where it started in real monetary share. Zero real gain.
📌 The Deal That Made Dollar Denomination Mandatory
The 1974 petrodollar arrangement was signed under the shadow of invasion planning — not as a free market choice but under the constraint of the 1953 precedent. Washington planned to invade. Saudi Arabia threatened to burn the oil fields. The deal was what happened next.
Gulf Petrodollar Drain: The Full Comparison Table
The three calculations on US Treasuries establish the drain. The comparison table across seven alternatives establishes the opportunity cost — what the same $100 billion would have become if the petrodollar arrangement had not made dollar denomination mandatory.
| Investment (1974) | Nominal 2024 | Real (inflation-adj) | M2-adjusted | Key factor |
|---|---|---|---|---|
| US Treasuries | $2,331B | $379B | ~$100B | Zero real gain — printing cancelled yield |
| Japanese Yen / JGBs | $665B | $369B | N/A | Low yield; yen rose 300→155/$ (48% gain) |
| German Bonds / Euro | $1,309B | $430B | N/A | DM/EUR appreciated ~40% vs dollar |
| Gold | $1,784B | $1,784B | $1,784B | $185→$3,300/oz — gold IS the inflation hedge |
| S&P 500 / NYSE | $14,727B | $2,560B | $632B | 10.5% avg total return — even M2-adj beats Treasuries 6x |
| NASDAQ | $28,900B | $5,145B | $1,240B | 12% avg return — M2-adj still 12x Treasuries |
| India Sensex (USD-adj) | $7,200B | $1,344B | N/A | 15.8% INR return — currency erosion (8→83 ₹/$) halves USD gain |
Three observations from the table that the Gulf Petrodollar Drain requires stating precisely.
First — Gold is the clearest indictment.
Gold earns no yield. It pays no coupons. It requires no financial infrastructure to hold. $100 billion in gold in 1974 at $185 per ounce is worth $1.78 trillion in 2024 at $3,300 per ounce — in nominal, real, and M2-adjusted terms simultaneously, because gold is the measure of purchasing power preservation rather than a claim on it. The Gulf held Treasuries that yielded nominal coupons and zero real gain. It could have held gold that yielded nothing and 17.8x real preservation. Washington’s Global Control War was fought to maintain an arrangement that kept Gulf wealth in Treasuries and out of gold — because gold-denominated Gulf reserves would not have financed American deficits at below-market real rates.
Second — American equities beat American bonds comprehensively.
The S&P 500’s 10.5% average total return produces $2,560 billion in real terms and $632 billion even after M2 adjustment — six times what Treasuries delivered on the same M2-adjusted basis. The S&P 500’s historical total return including dividends reinvested has averaged approximately 10.5% annually since the mid-1970s, making American equities the world’s best documented long-term wealth-building instrument. NASDAQ produces $1,240 billion M2-adjusted — twelve times Treasuries.
The petrodollar arrangement directed Gulf wealth specifically into Treasury bonds — Washington’s debt instrument — rather than American equities. The Gulf was financing Washington’s deficit, not participating in American productive growth.
Washington kept the productive investment for American pension funds and sovereign wealth funds of allied states. Gulf dollars went to the debt market that funded the military that enforced the arrangement that kept Gulf dollars in the debt market.
Third — the Indian market lesson carries its own warning.
Blog 9 documented the Global South War Narrative — the six billion people whose economic interests the petrodollar system was designed to manage. The Sensex is the Global South’s most instructive mirror. The BSE Sensex launched at 100 in 1979 and stands near 75,000 in 2024 — a 750-fold nominal return in rupees, a 15.8% annual compounding rate that outperforms every instrument in the table in INR terms. BSE data confirms the Sensex’s extraordinary nominal performance — one of the world’s best-performing major indices across the post-liberalisation period. But the rupee fell from 8 to 83 per dollar across the same period — a 10.4-fold depreciation. Reserve Bank of India historical exchange rate data documents the rupee’s systematic depreciation against the dollar across five decades of dollar denomination in India’s trade and reserve management. A Gulf investor converting that spectacular INR return back to dollars receives $7,200 billion nominally and $1,344 billion in real USD terms. Better than Treasuries. Far below NASDAQ. The Indian market lesson is the currency lesson: nominal returns in a depreciating currency are partially illusory. The rupee’s depreciation against the dollar is itself partly the consequence of the same dollar denomination architecture the Gulf Petrodollar Drain documents — India’s exports must be priced in dollars, India’s imports must be paid in dollars, India’s reserve management must hold dollars, and the dollar’s periodic strengthening through Fed tightening cycles compresses the rupee regardless of India’s domestic economic performance.
Fourth — the Confiscation Risk and the Worrying Pattern.
United States has a distinct pattern of confiscating the dollar denomination of reserves of sovereign nations at will. The Gulf states are not adversaries. They are nominally allied. But the confiscation risk is not about being an adversary — it’s about what happens when the relationship changes, or when Washington needs leverage in a negotiation, or when domestic American politics makes a Gulf state a useful target. Iran’s assets were frozen in 1979 and remain effectively frozen 45 years later. Afghanistan’s $7 billion was frozen in 2021 and handed partially to 9/11 victim families — money belonging to one of the world’s poorest populations. The pattern is not “we confiscate enemies.” The pattern is “we confiscate whoever we can when we need to.”
📌 The Gulf Dollar Exit This Arithmetic Explains
Saudi Arabia did not renew the petrodollar agreement in 2024. The Gulf Dollar Exit Reckoning — why fifty years of zero real gain on mandatory Treasury investment makes non-renewal the logical conclusion.
Gulf Petrodollar Drain: The Three Debasement Cycles That Produced Zero
The zero real gain was not produced by a single event. It was produced by three documented dollar debasement cycles, each of which transferred Gulf wealth to Washington through the denomination mechanism, and each of which the Gulf had no power to prevent because the petrodollar arrangement made exit existentially dangerous.
First cycle — the 1970s inflation decade.
US inflation averaged 9.2% per annum from 1974-1982. The Minneapolis Federal Reserve confirms that a dollar received in 1974 was worth approximately 45 cents in real terms by 1982. Gulf states receiving dollars for oil throughout this period watched their earnings halve in eight years.
The petrodollar arrangement required them to price oil in the currency Washington was destroying to finance the Vietnam war’s aftermath. There was no exit clause. The 1953 precedent remained the enforcement mechanism.
Second cycle — the post-2008 quantitative easing era.
The Fed’s balance sheet grew from $900 billion in 2008 to $9 trillion by 2022 — $8 trillion in new money created to buy US Treasury bonds. This money creation served American domestic objectives. For Gulf states holding Treasuries, the effect was yield suppression — Treasury yields fell to historic lows, real yields turned negative between 2010 and 2021. Gulf states were lending money to Washington and receiving back less purchasing power than they lent. They paid Washington to hold their savings. The Gulf Dollar Exit Reckoning documented Saudi Arabia’s 2024 non-renewal. The QE era’s negative real yields were the most visible expression of why.
Third cycle — the 2020-2022 pandemic printing.
The Fed created $4.8 trillion in new money in 2020-2021 alone — the largest peacetime monetary expansion in American history — producing 9.1% US inflation in 2022. Gulf sovereign wealth funds holding dollar assets absorbed this inflation. The Gulf did not receive a pandemic dividend. It absorbed a pandemic inflation tax levied by the Fed for American economic stabilisation purposes, with no Gulf input into the decision and no Gulf compensation for the loss.
Three cycles. Three transfers. The nominal yield on Treasury bonds partially offset each transfer — but only partially. The M2-adjusted calculation shows the net: $100 billion in 1974 purchasing power, $100 billion in 2024 purchasing power. The petrodollar arrangement was not a bad investment in the ordinary sense of losing money. It was a structurally captured investment that delivered precisely the return Washington needed it to deliver — enough nominal yield to maintain Gulf participation, never enough real return to allow Gulf wealth to compound into an independent economic power base. The Gulf Petrodollar Drain closing observation: the petrodollar arrangement was the most elegant financial capture mechanism in history. The Gulf was paid to finance its own containment. And until the UAE OPEC Split of May 1 2026, the Gulf had no institutional mechanism to exit the arrangement without triggering the security consequences that Blog 37 documented as the deal’s founding enforcement mechanism.
Next: Dollar Machine Reckoning — Blog 50 in West Asia’s Endless War examines the five-component extraction architecture that made the Petrodollar Drain structurally invisible — the Tax-and-Buy system, the Council Bills equivalent that extracts from every Gulf transaction with every country in the world, the Home Charges that made the Gulf pay for its own Praetorian Guard, the Commercial Captivity that prevented Gulf industrial development, and the Surveillance Architecture that made every dollar transaction visible to Washington. The drain has a name. The machine that ran it had five components. Part of the West Asia’s Endless War Series on hinduinfopedia.com.
Feature Image: Click here to view the image.
Videos
Glossary of Terms
[…] भारत / GB […]
[…] Blog 49 (Gulf Petrodollar Drain) established the arithmetic: $100 billion invested in US Treasuries in 1974 is worth $100 billion in real purchasing power today — zero real gain across fifty years, after three dollar debasement cycles consumed what the nominal yield appeared to produce. Blog 50 examines the architecture that made the drain structurally invisible and structurally mandatory. The Gulf has run Washington’s currency machinery for fifty years. Washington owns the dollar. The Gulf is the mint that gives it global power. The return: zero real gain. The The Dollar’s Gulf Mint identifies five components — each with a documented petrodollar equivalent, one of which extends the extraction beyond Gulf-US transactions to every trade the Gulf conducts with every country in the world. […]
[…] ब्लॉग 49 (खाड़ी पेट्रोडॉलर निकास) ने गणना स्पष्ट की: 1974 में अमेरिकी ट्रेजरी में लगाए गए 100 अरब डॉलर आज भी वास्तविक क्रय शक्ति में 100 अरब डॉलर के बराबर हैं — पचास वर्षों में कोई वास्तविक लाभ नहीं, क्योंकि तीन डॉलर अवमूल्यन चक्रों ने नाममात्र प्रतिफल को समाप्त कर दिया। ब्लॉग 50 उस संरचना का अध्ययन करता है जिसने इस निकास को संरचनात्मक रूप से अदृश्य और अनिवार्य बनाया। गल्फ ने पचास वर्षों तक वॉशिंगटन की मुद्रा व्यवस्था को संचालित किया। डॉलर पर नियंत्रण वॉशिंगटन का है। गल्फ वह टकसाल है जो उसे वैश्विक शक्ति देता है। परिणाम: शून्य वास्तविक लाभ। डॉलर की खाड़ी टकसाल पाँच घटकों की पहचान करता है — प्रत्येक का एक प्रमाणित पेट्रोडॉलर समकक्ष है, जिनमें से एक निकास को गल्फ-अमेरिका लेनदेन से आगे बढ़ाकर विश्व के हर देश के साथ होने वाले हर व्यापार तक फैलाता है। […]
[…] https://hinduinfopedia.com/gulf-petrodollar-drain-a-reckoning-of-west-asias-endless-war-49/ […]
[…] Blog 49 (Gulf Petrodollar Drain) established the fifty-year investment loss — $100 billion in 1974 Treasuries worth $100 billion in real value today, zero real gain across three debasement cycles. Blog 50 (The Dollar’s Gulf Mint) named the five-component extraction machine — Tax-and-Buy, Council Bills equivalent, Home Charges, Commercial Captivity, Surveillance Architecture. Blog 51 brings the argument to the transaction level: what does the Gulf Dollar Toll actually cost on every oil sale, every commodity trade, every payment received and converted? The base is precise — $100 billion in UAE-India trade and $101.8 billion in UAE-China trade in 2024, about $202 billion total. The toll is measured across six dimensions. The total is not small. […]
[…] 49, 50, and 51 established the trilogy: the Gulf Petrodollar Drain proved zero real gain across fifty years of Treasury investment, The Dollar’s Gulf Mint named […]
[…] 49, 50 और 51 ने त्रयी स्थापित की। गल्फ पेट्रोडॉलर ड्रेन ने पचास वर्षों में वास्तविक लाभ शून्य […]
[…] Read […]
[…] prosecuted against a theological infrastructure Washington built, using a military whose costs are financed by the Gulf’s petrodollar recycling into US Treasuries that Blog 49 (Gulf Petrodollar… established earns zero real return. The manufacturer is fighting its own product with the […]
[…] over strategic calculation), vouchsafed its treasury to Gulf states earning zero real return (Blog 49), revealed its strategies before Congressional votes (Hegseth’s pre-vote declaration), fired […]